Tutorial 2 of 8
Deals, pipelines and the forecast
Beginner 7 min
Move deals through your own pipeline on the kanban board or by keyboard, switch to the table, set probabilities and expected close dates and read the weighted forecast on the dashboard.
A deal is a sale you are working on: a title, a value, the company and people involved, an owner, an expected close date and the stage it has reached. Stages belong to a pipeline, and you can have as many pipelines as you need — for example new business and renewals.
The board
The Deals view opens as a kanban board with one column per stage. Each column header shows the number of deals, their total value, the stage's probability and the weighted value (value × probability). Won and lost columns sit on the right.
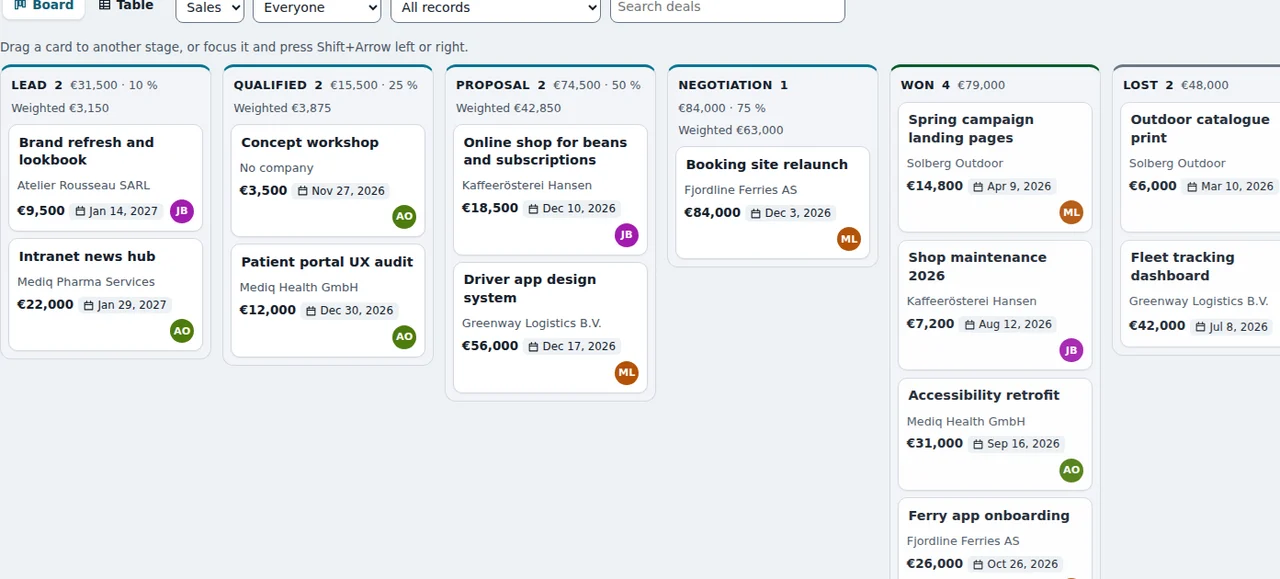
Drag a card to another column to move the deal. With the keyboard, Tab to a card (or press J and K) and press Shift+Arrow right or Shift+Arrow left — Rapport announces the new stage. Moving a deal into the lost column asks for a lost reason, such as “price” or “chose a competitor”; the reasons you typed before are suggested.
The filters above the board choose the pipeline, the owner (Everyone or one person) and a saved segment, and the search box finds deals by title, company or tag.
The table
Table shows the same deals as a sortable table with company, stage, value, probability, weighted value, expected close and owner. Click a column header to sort; click again to reverse. This is the quickest way to find deals whose expected close date has passed.
Inside a deal
Click a deal to open it. Besides title, value and stage you set the expected close date, the company, the contacts and the owner. Probability is empty by default, which means the stage's probability counts; type your own number when you know better (it only applies while the deal is open). The side panel lists the deal's activities, quotes and its timeline with every stage change.
Design your pipelines
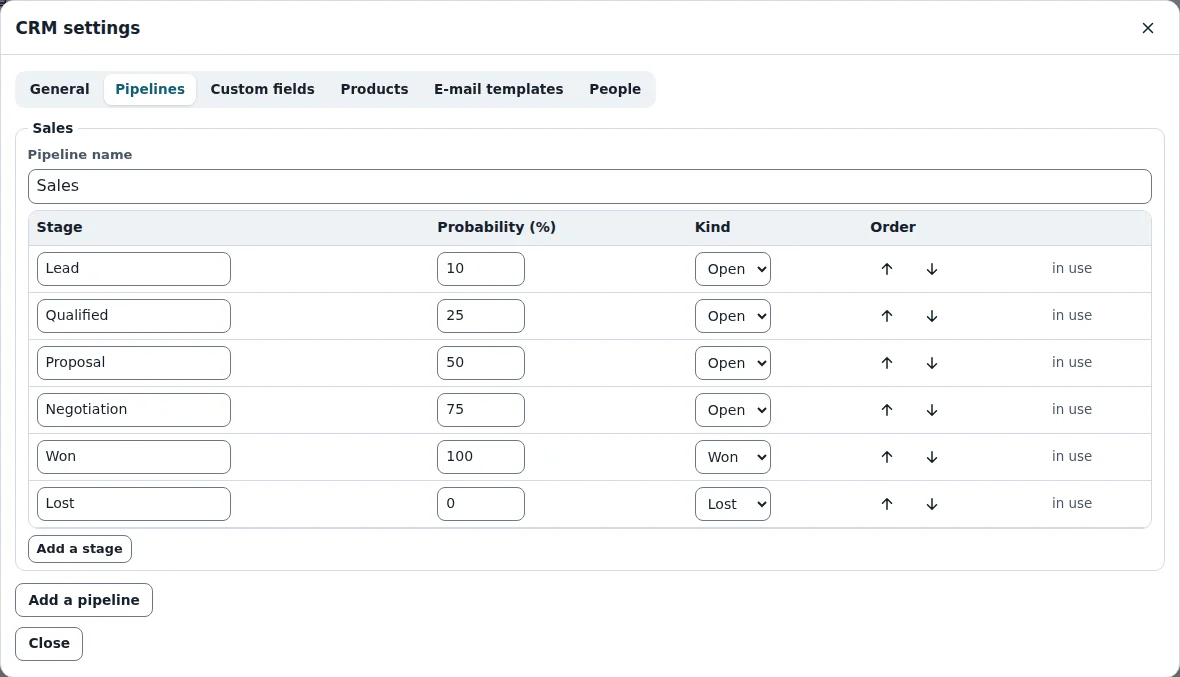
CRM → Pipelines and stages… edits the stages of each pipeline: name, probability in percent and kind (Open, Won or Lost). Arrows change the order. A stage that still holds deals shows “in use” and cannot be deleted. Add a pipeline starts a new one with its own stages.
The dashboard
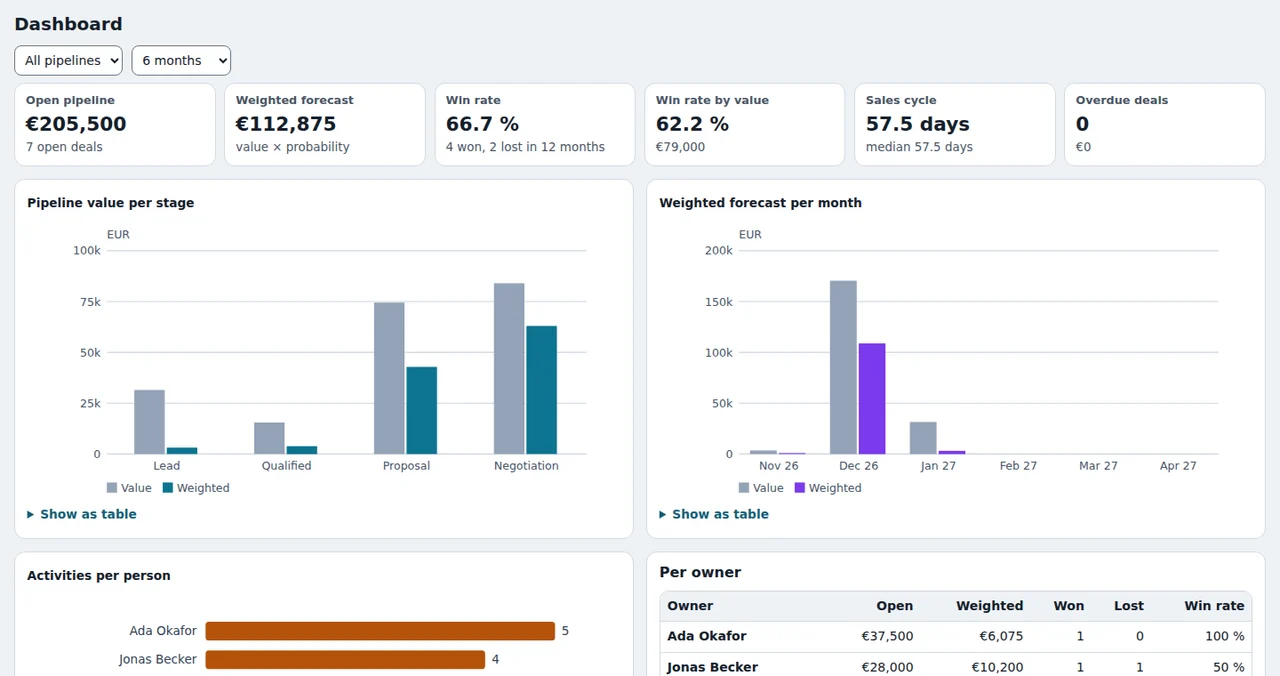
The Dashboard adds it all up for the chosen pipeline (or All pipelines); the second menu sets how many months the forecast looks ahead (3, 6 or 12). Win rate, sales cycle and activities always cover the last 12 months.
- Open pipeline and Weighted forecast — the sum of open deal values, and of value × probability
- Win rate — won deals ÷ (won + lost) closed in the period; Win rate by value does the same with amounts
- Sales cycle — average and median days from creation to winning
- Overdue deals — open deals whose expected close date has passed
Below, the charts show the pipeline value per stage, the weighted forecast per month (by expected close date) and activities per person. Every chart has Show as table for screen readers and exact numbers, and the Per owner table compares your team.
The same forecast is available without the app: the tool rapport-pipeline-forecast reads a deals CSV (for example a Pipedrive export) and returns these numbers.
Ready to try it?